Trading journal report layouts
Arrange metric, graph, and table cards on a trading journal session Report tab, bound to your browser-side calculations. Open any session in the web app and use the Report tab to review performance your way.
Default and owned layouts
EndureTrade ships a public default report layout so every session has a useful Report out of the box. Create owned layouts when you want a named arrangement of cards — plan limits apply; see pricing.
Cards and calculations
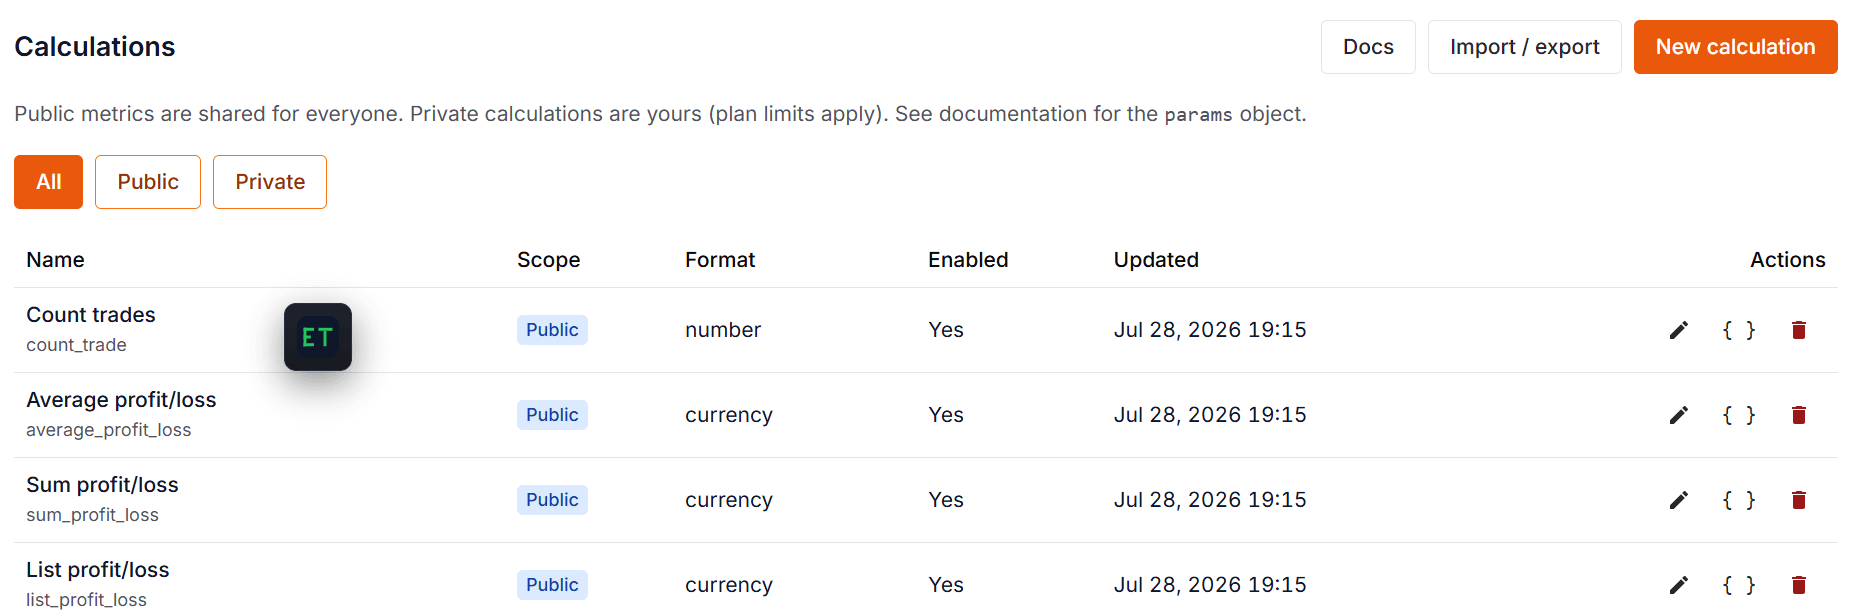
Layouts are rows of metric, graph, and table cards bound to calculations (public defaults and your private functions). Calculations run only in your browser against that session's trades.
Editing layouts
From the session Report tab, edit the layout to add rows and cards. Open a metric, graph, or table card to bind calculations, apply trade filters, and set formatters, then Save or Save as. Switch layouts anytime when reviewing a session.
Report layouts in the web app
Default report, empty canvas, metric/graph/table editors, then Save as and the calculations that power the cards.
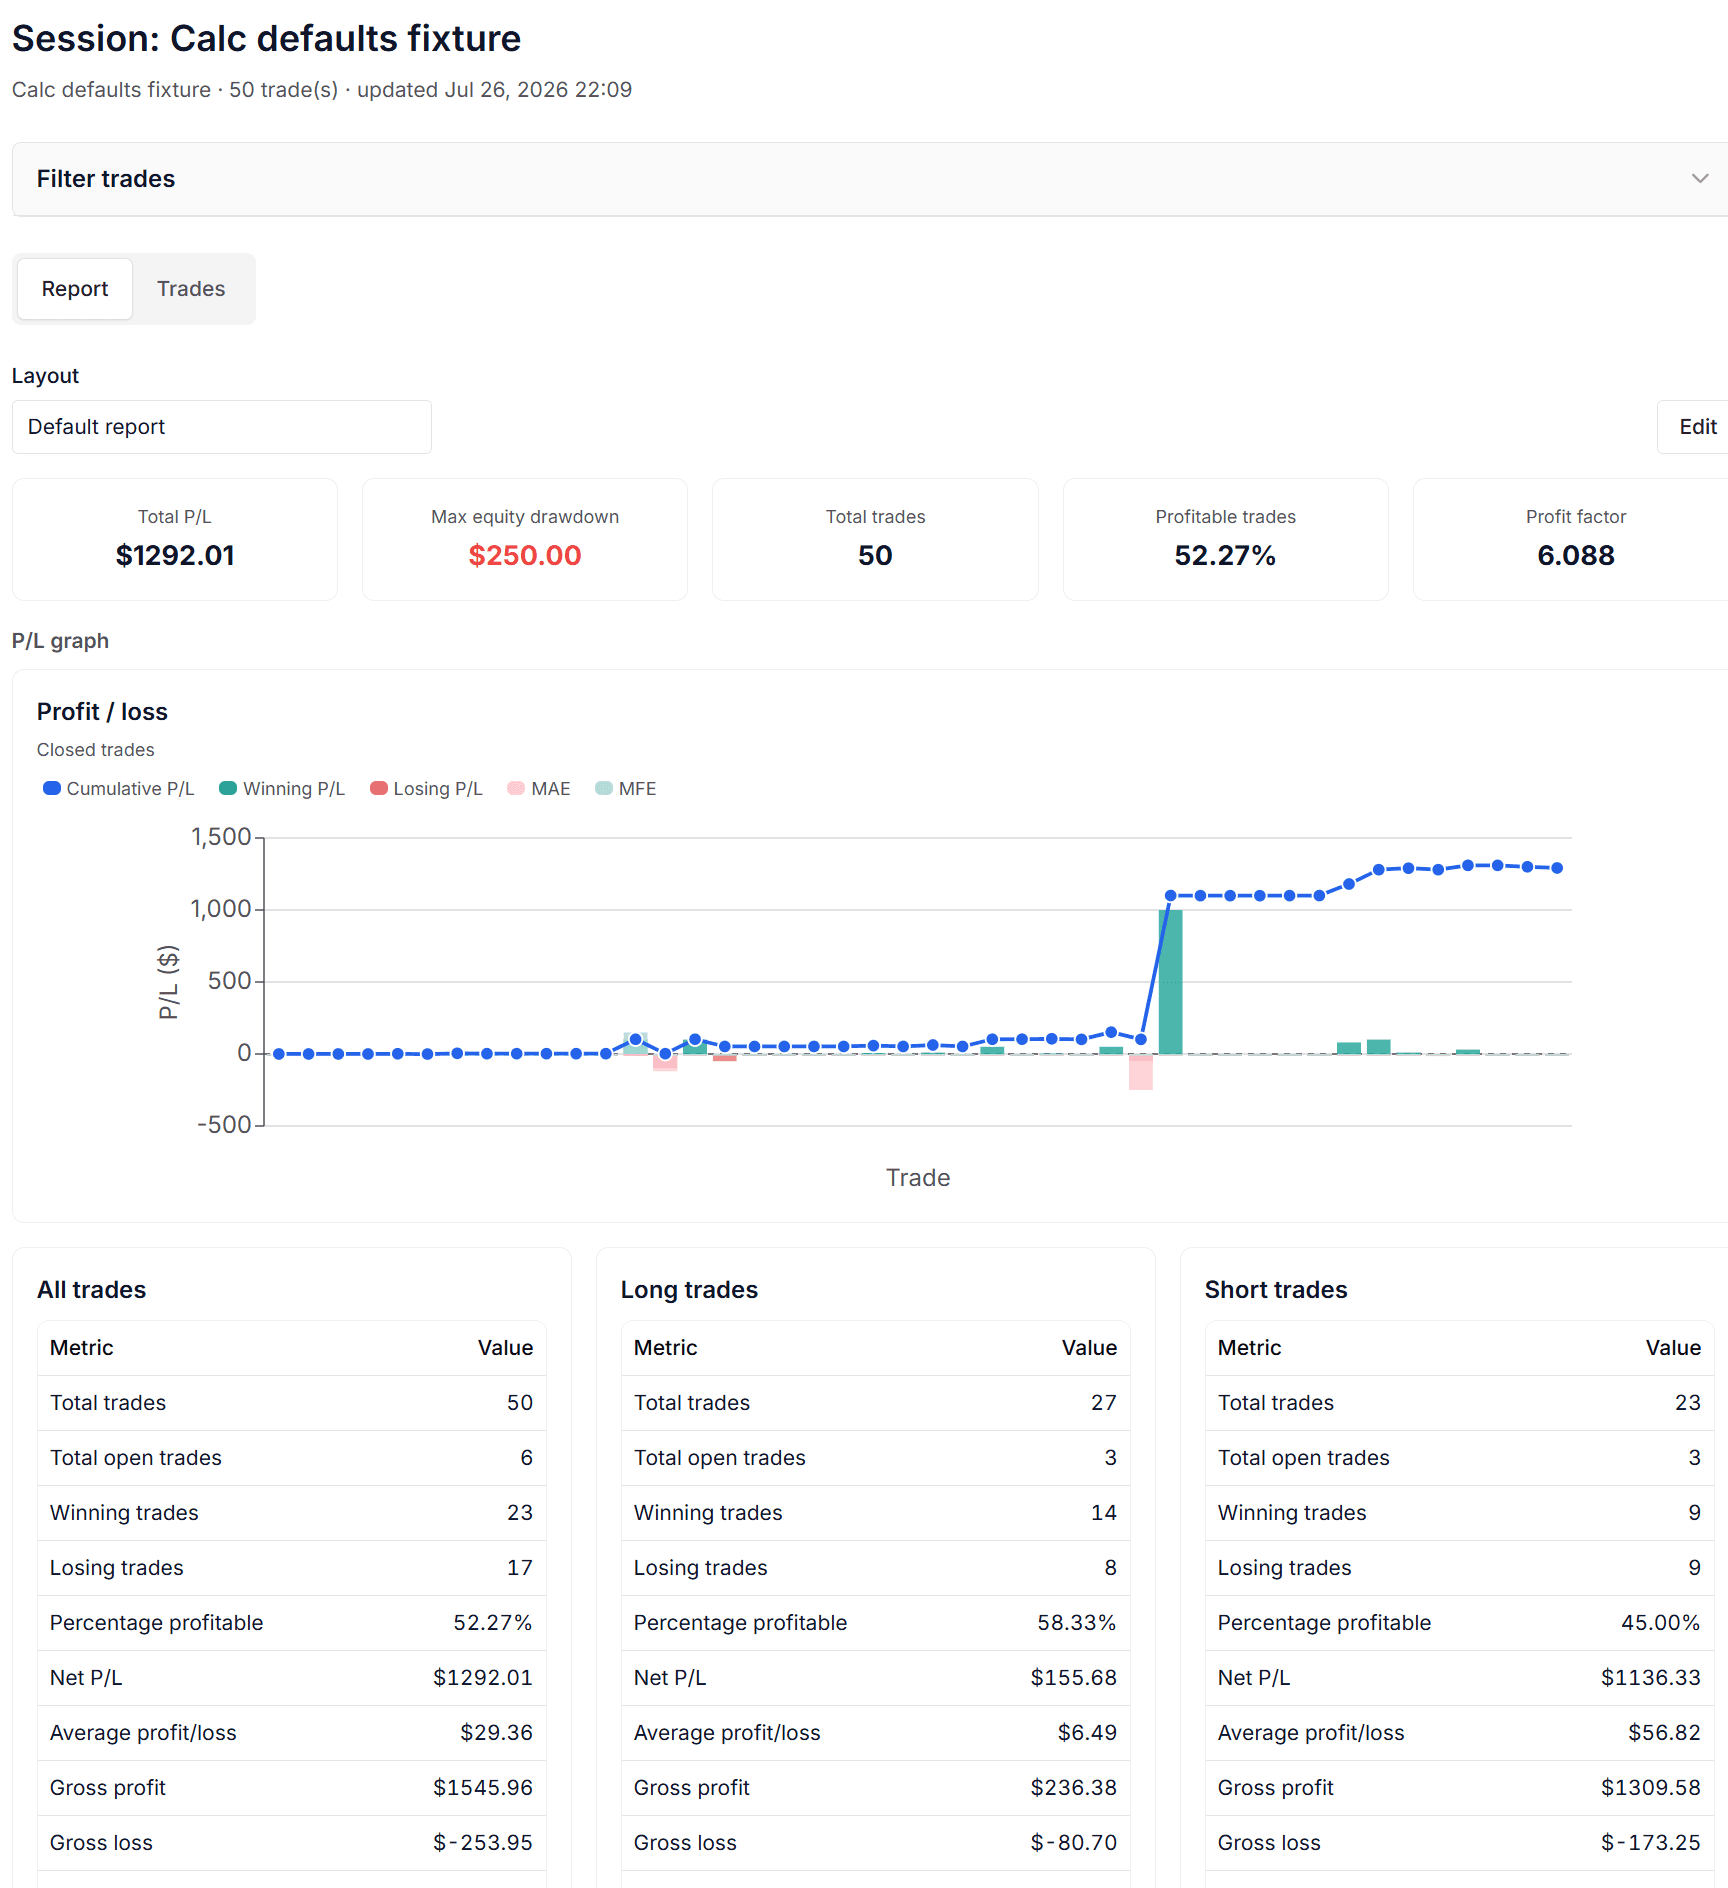
Session Report with performance metrics
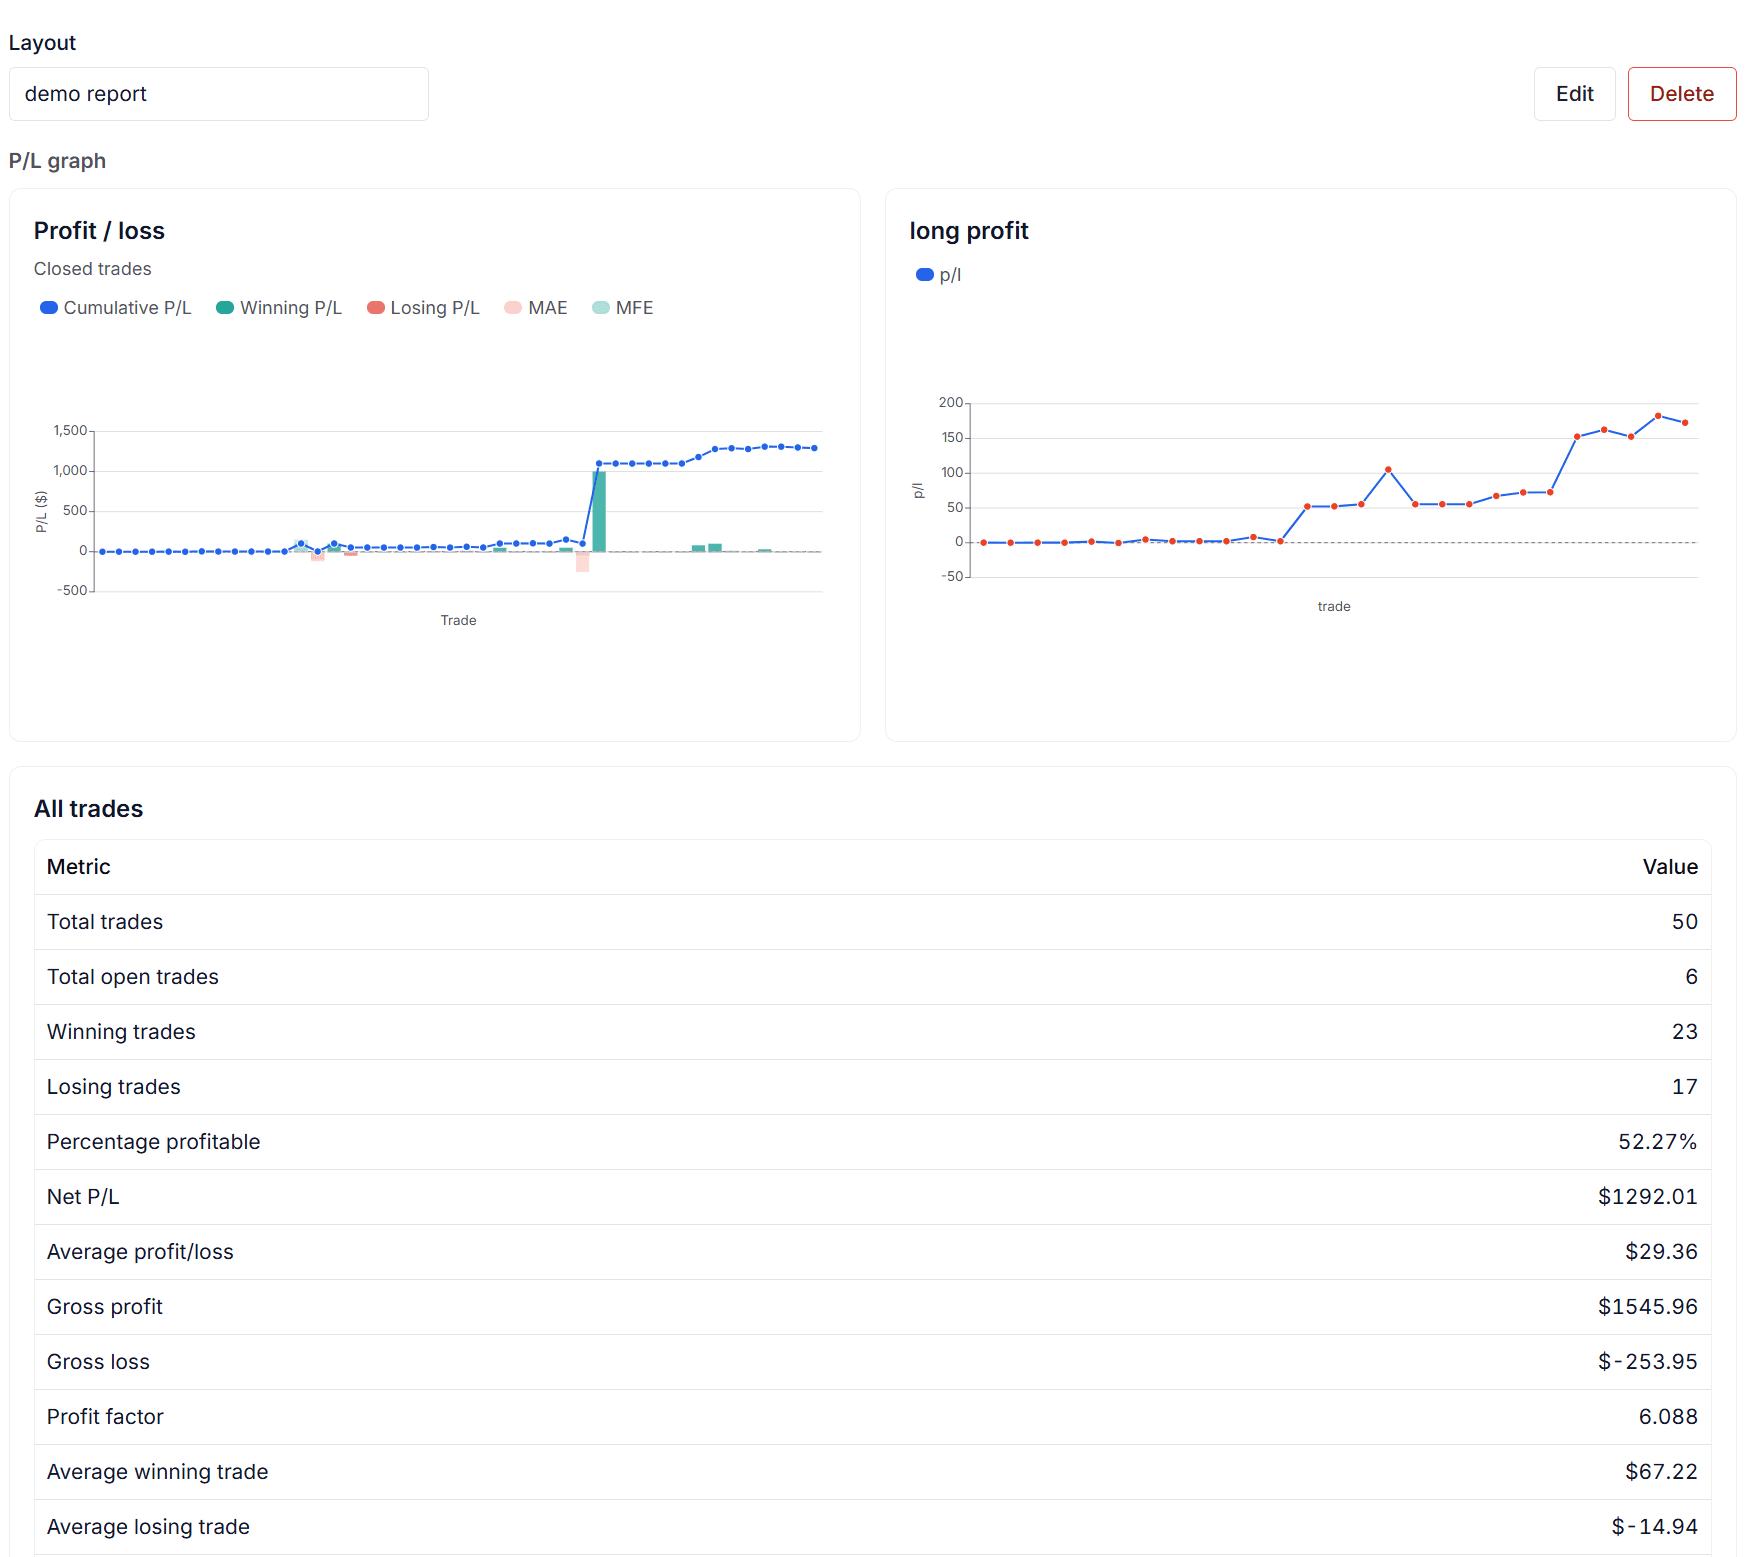
Open a session Report tab to review metrics driven by calculations. Start from the public default layout, then customise when you need a different view.
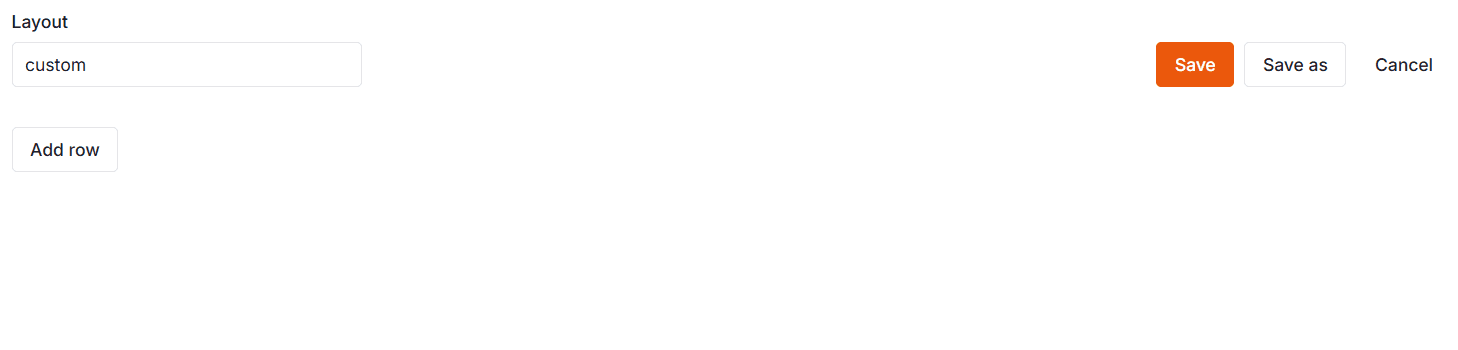
Start from an empty layout
Name the layout, add rows, then place metric, graph, and table cards. Save updates this layout; Save as creates a new owned copy.
Arrange cards on the layout
Edit mode shows rows, Add card, and the selected card’s editor. Rearrange metric, graph, and table cards bound to your calculations.
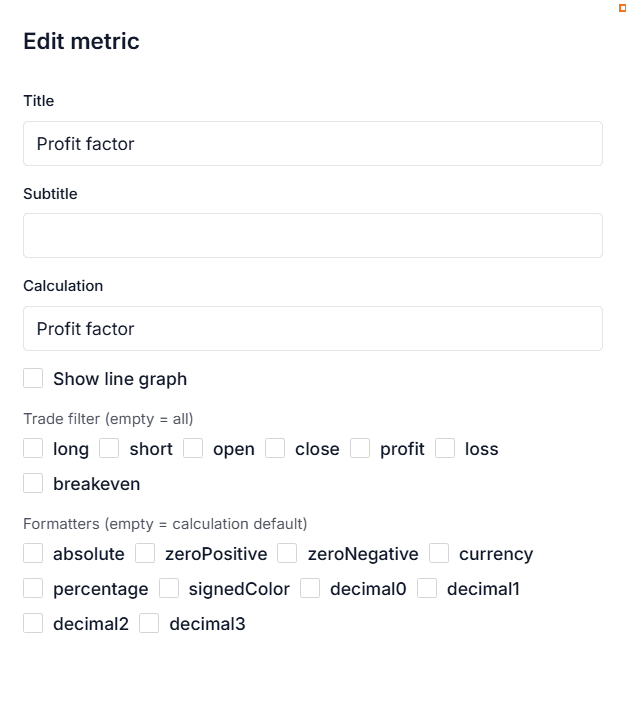
Edit a metric card
Set title, bind a calculation, optionally show a line graph, and apply trade filters or number formatters for that card.
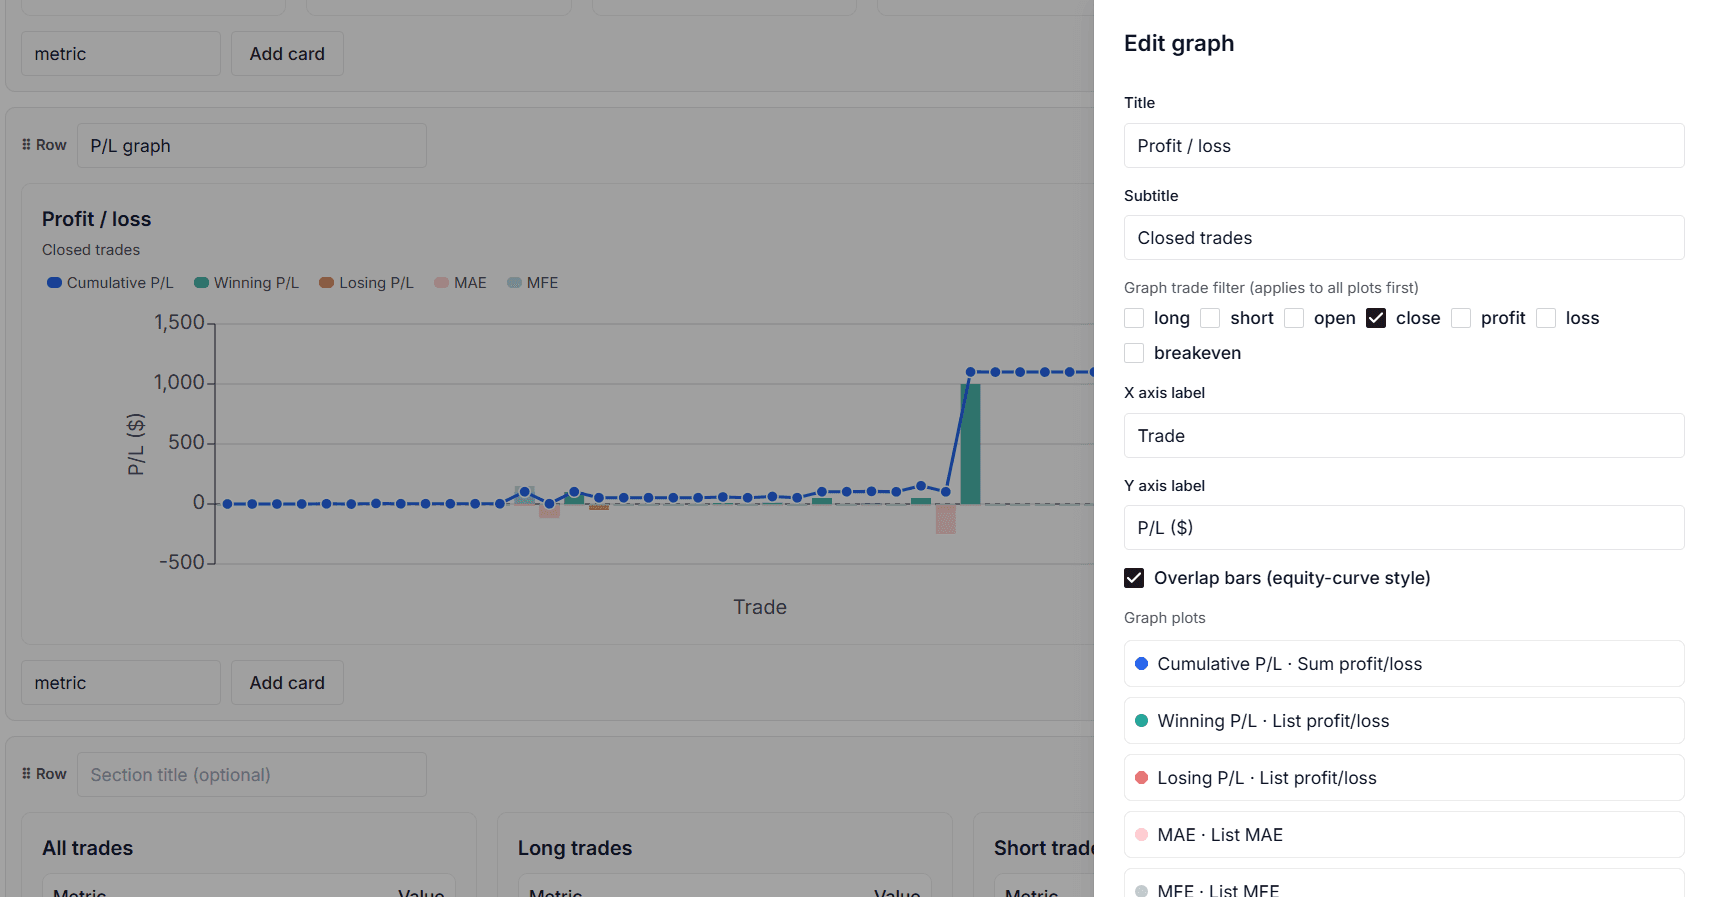
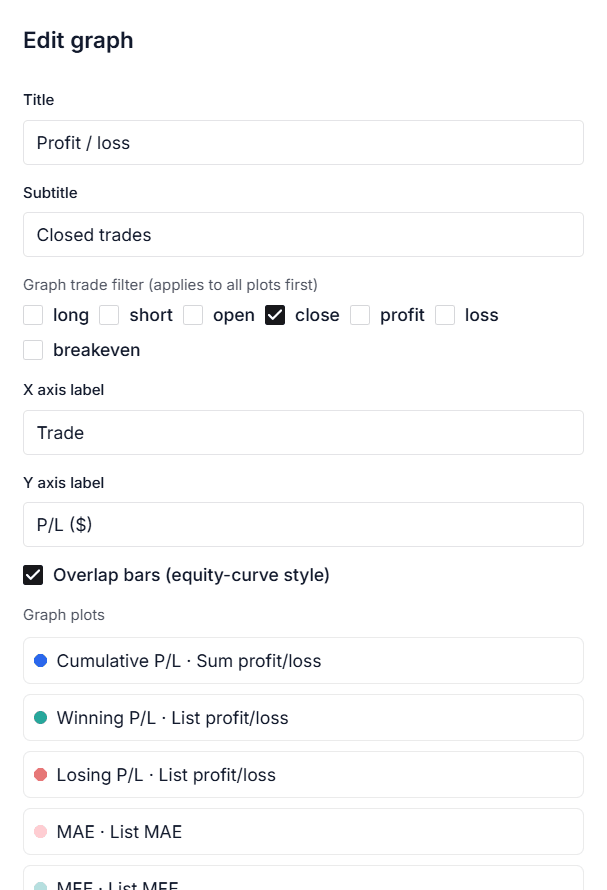
Edit a graph card
Choose title, trade filters, axis labels, overlap style, and which calculations plot as series on the graph.
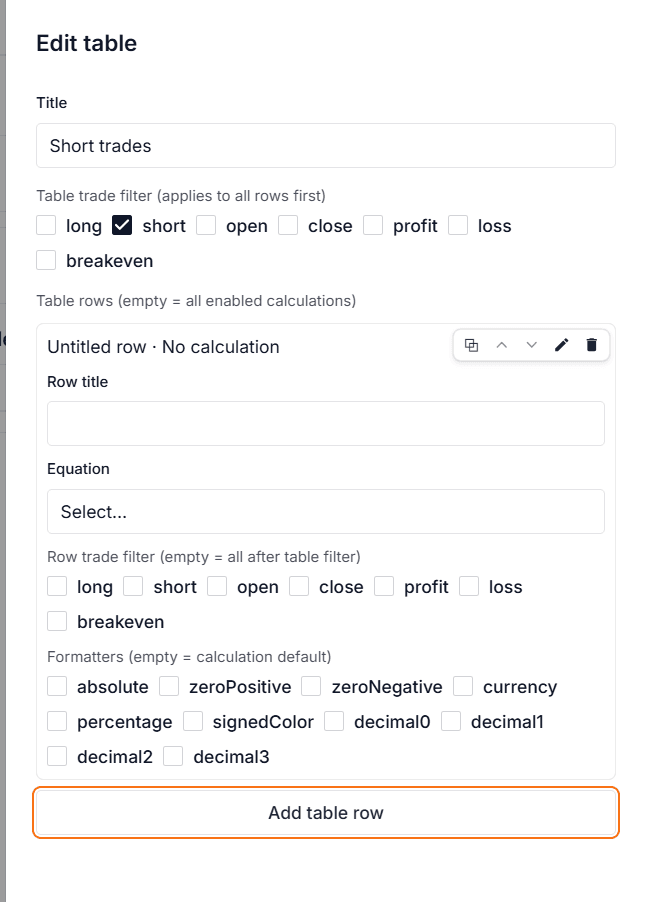
Edit a table card
Filter the whole table, then add rows with a calculation, optional row filter, and formatters. Empty rows use all enabled calculations.
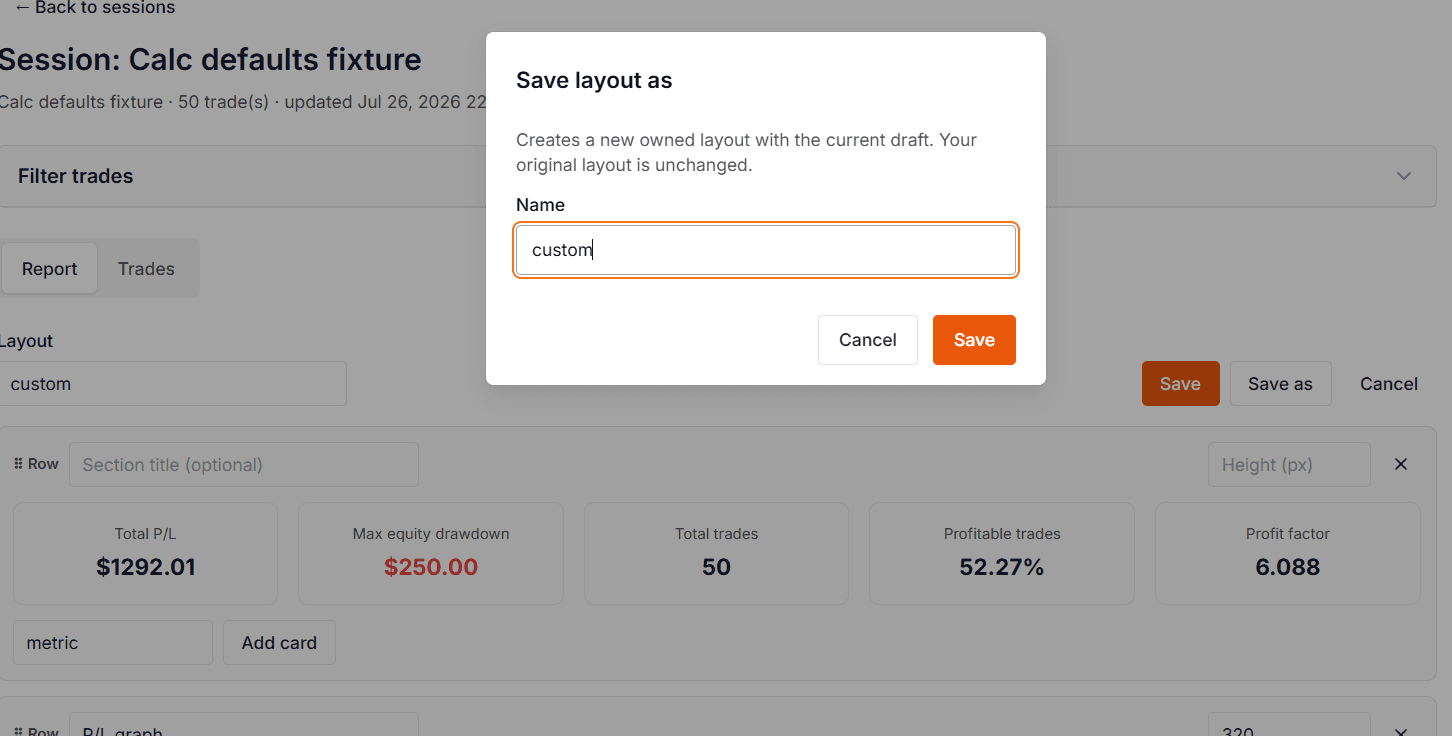
Save a named layout
Save as creates a new owned layout from the current draft without changing the original. Name it, then switch layouts on any session Report.
Saved custom report layout
Your owned report layouts appear on the session Report tab — filter trades and bind cards to the calculations you care about.
Custom session calculations
Define browser-side metrics for session performance. Public defaults ship with the product; add private calculations for your own formulas.