How EndureTrade works
Three steps: journal on sites you enable, speed up with actions and pinned memos, then review in the web app. Not installed yet? Follow the Chrome extension guide.
Deep dives: journal actions, memos, calculations, report layouts. Already set up? Open the web app.
See the workflow
Watch the floating bar, logging a trade, and reviewing a session — then follow the three phases below.
More walkthroughs on @EndureTrade on YouTube.
1. Journal on the chart
Create or select a session, open and close trades, then add tags, strategy checklists, notes, and screenshots from the floating bar.
Step 1
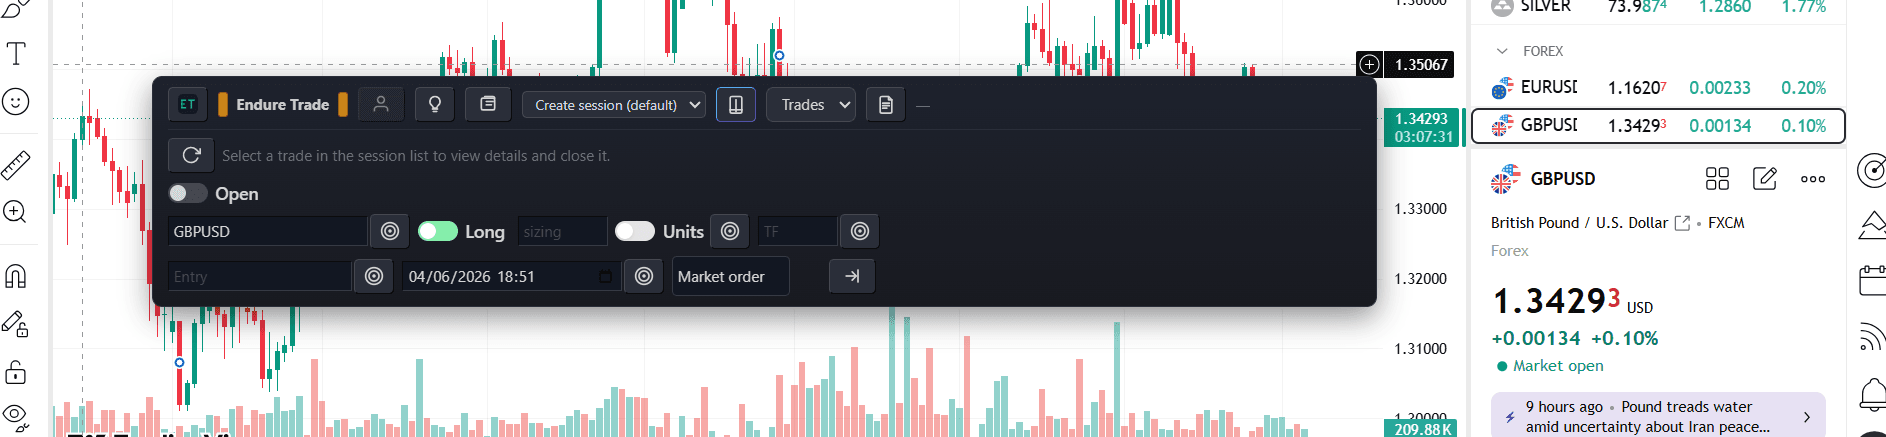
Add a trade from the floating bar
Pick a session, open a trade on the chart, and fill symbol, side, sizing, and entry — you choose what to log.
Step 2
Tag trades from the floating bar
Label setups, mistakes, or context while the trade is still open. Tags sync to the web app for filtering during review.

Step 3
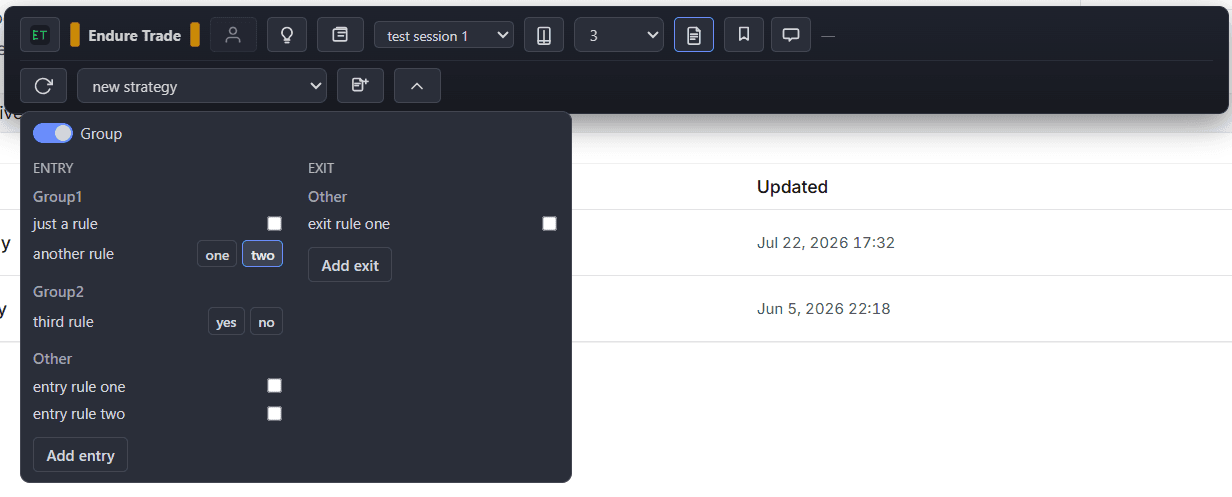
Run your strategy checklist on the chart
Attach a strategy to the session and tick through your rules before and during the trade — without switching tabs.
Step 4
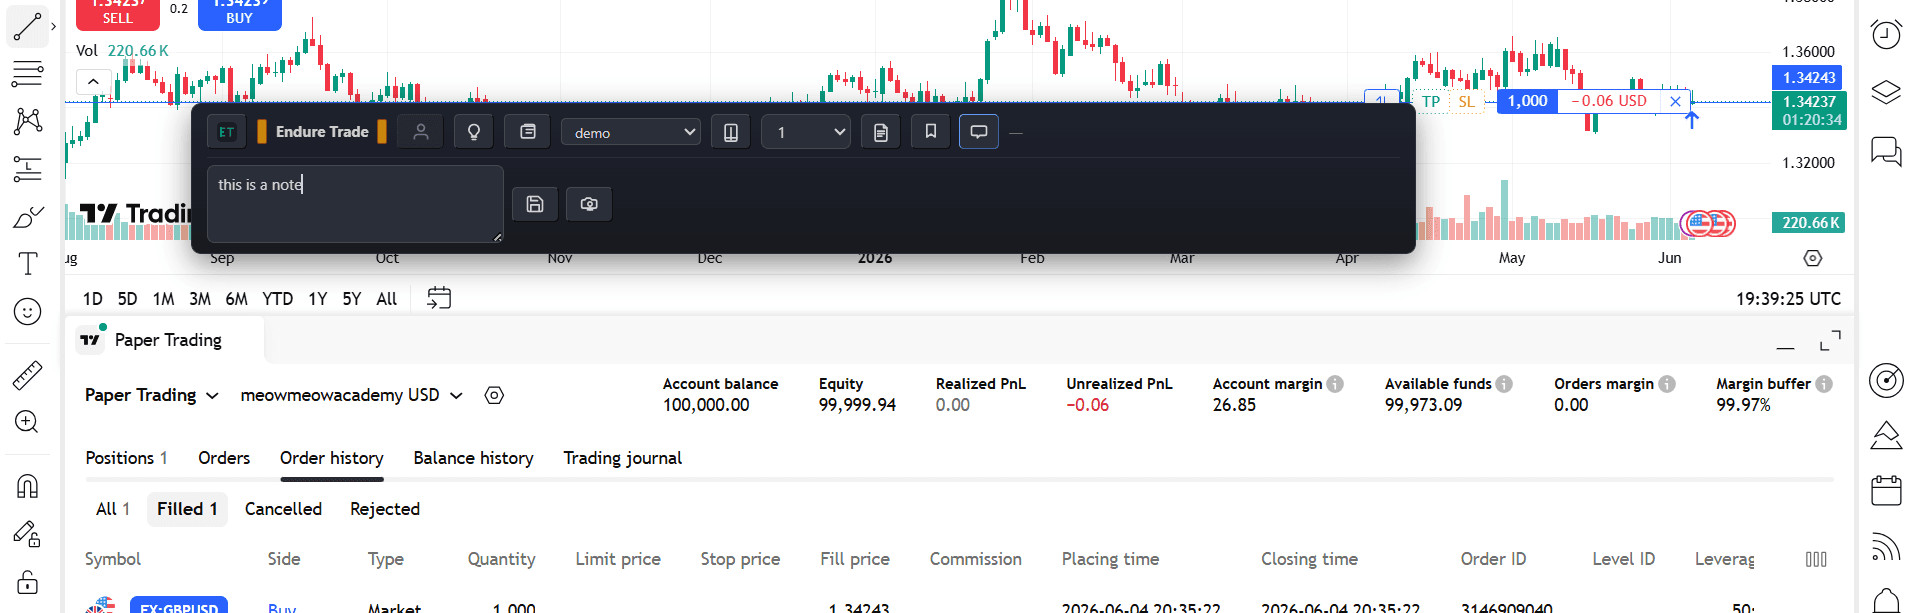
Notes and in-tab chart screenshots
Save exact chart states, including multi-timeframe context, and attach them to the trade you are journaling.
2. Speed up and stay oriented
Use one-click journal actions to fill forms or click page controls, and pin a memo so your playbook stays visible while you journal.
Step 1
One-click journal actions on the bar
Add custom buttons that fill your trade form or click page controls on chart sites you enable — without leaving the page.

Step 2
Fill trade fields from the page
Fill-data and fill-from-history actions pull values into your open or close trade form so logging stays fast while you stay on the chart.

Step 3
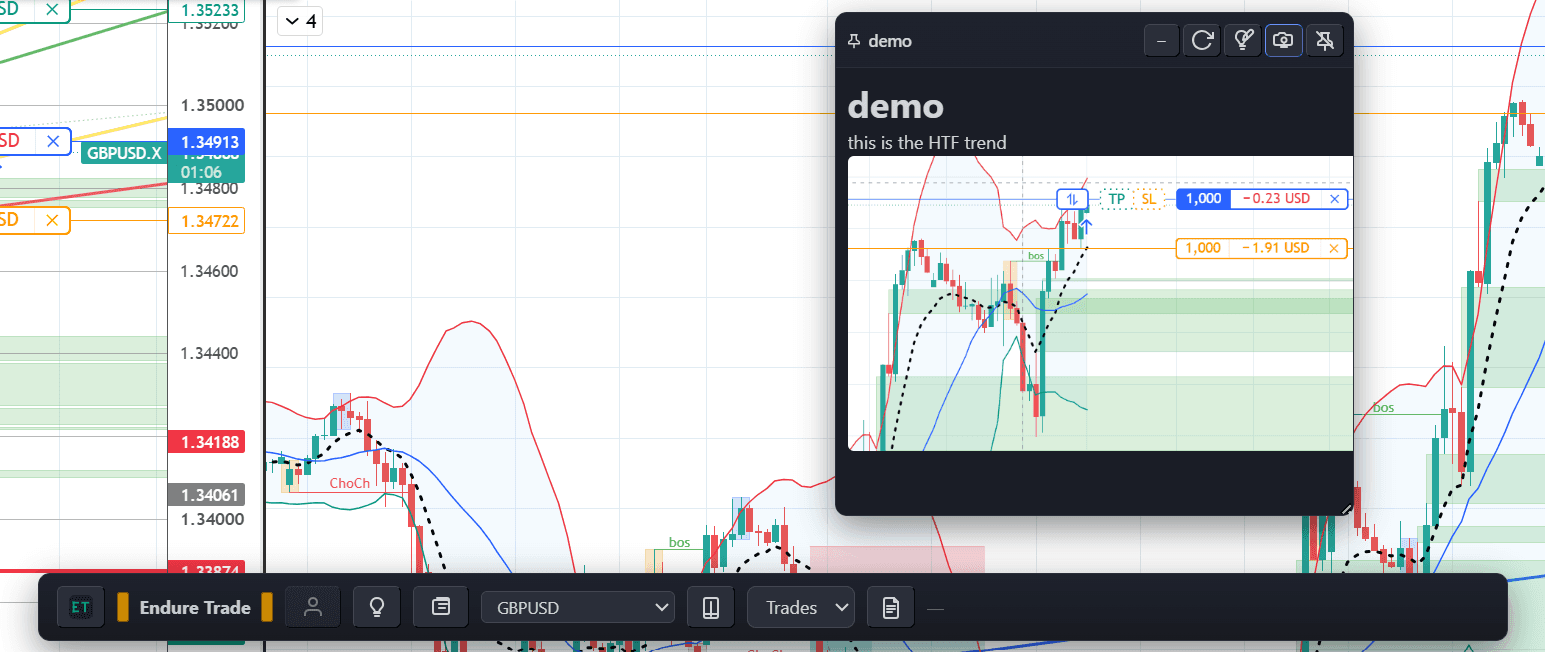
Pin a memo to the chart page
Pin a personal Markdown memo as a floating window on the page — drag, resize, and keep your playbook visible while you journal.
3. Review in the web app
Browse sessions and memos, run browser-side calculations, and arrange custom report layouts on the session Report tab.
Step 1
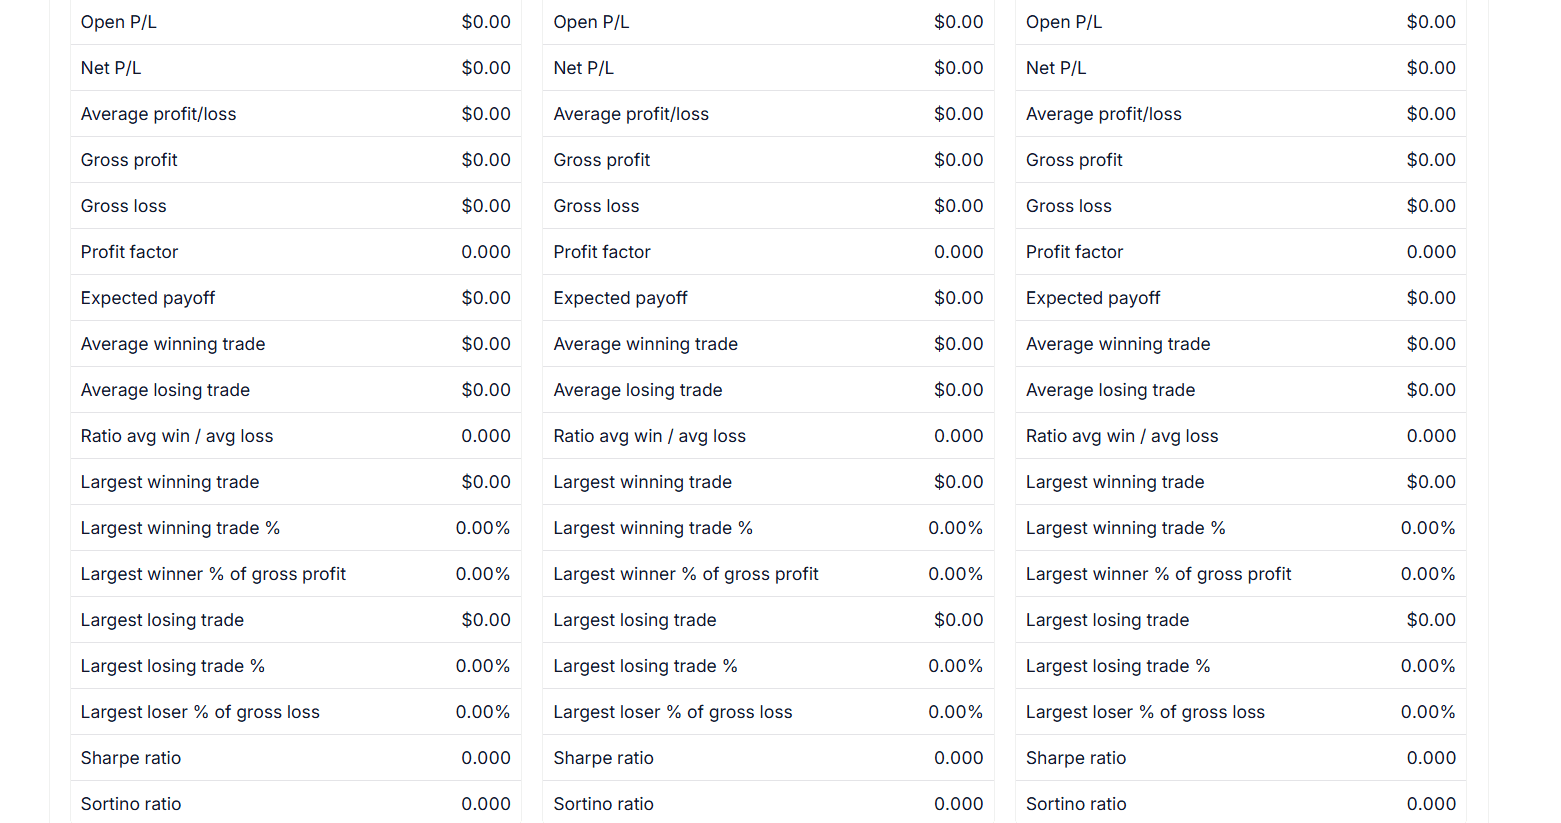
Review sessions in the web app
Browse saved sessions and trades with tags and strategies visible at a glance. Deeper dashboards and analytics are on the roadmap.
Step 2
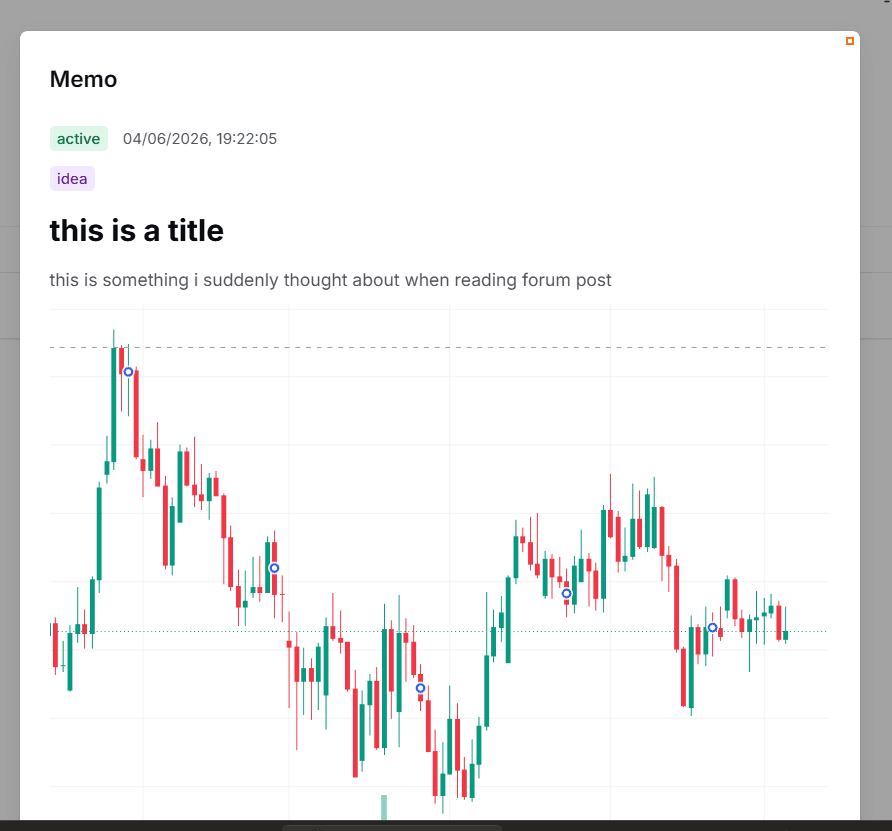
Research memos with images
Capture market notes in markdown, embed chart images while you study, and revisit memos alongside your sessions.
Step 3
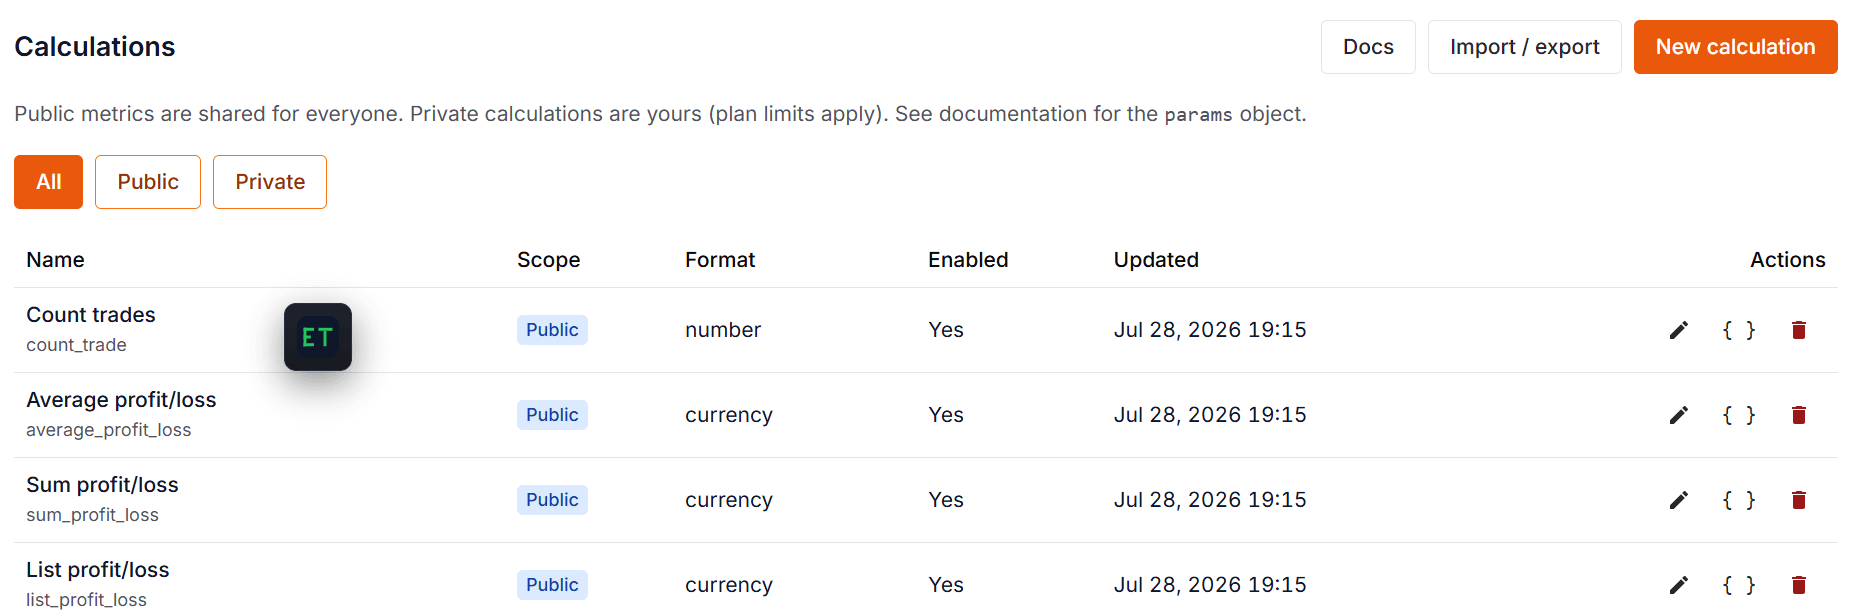
Custom session calculations
Define browser-side metrics for session performance. Public defaults ship with the product; add private calculations for your own formulas.
Step 4
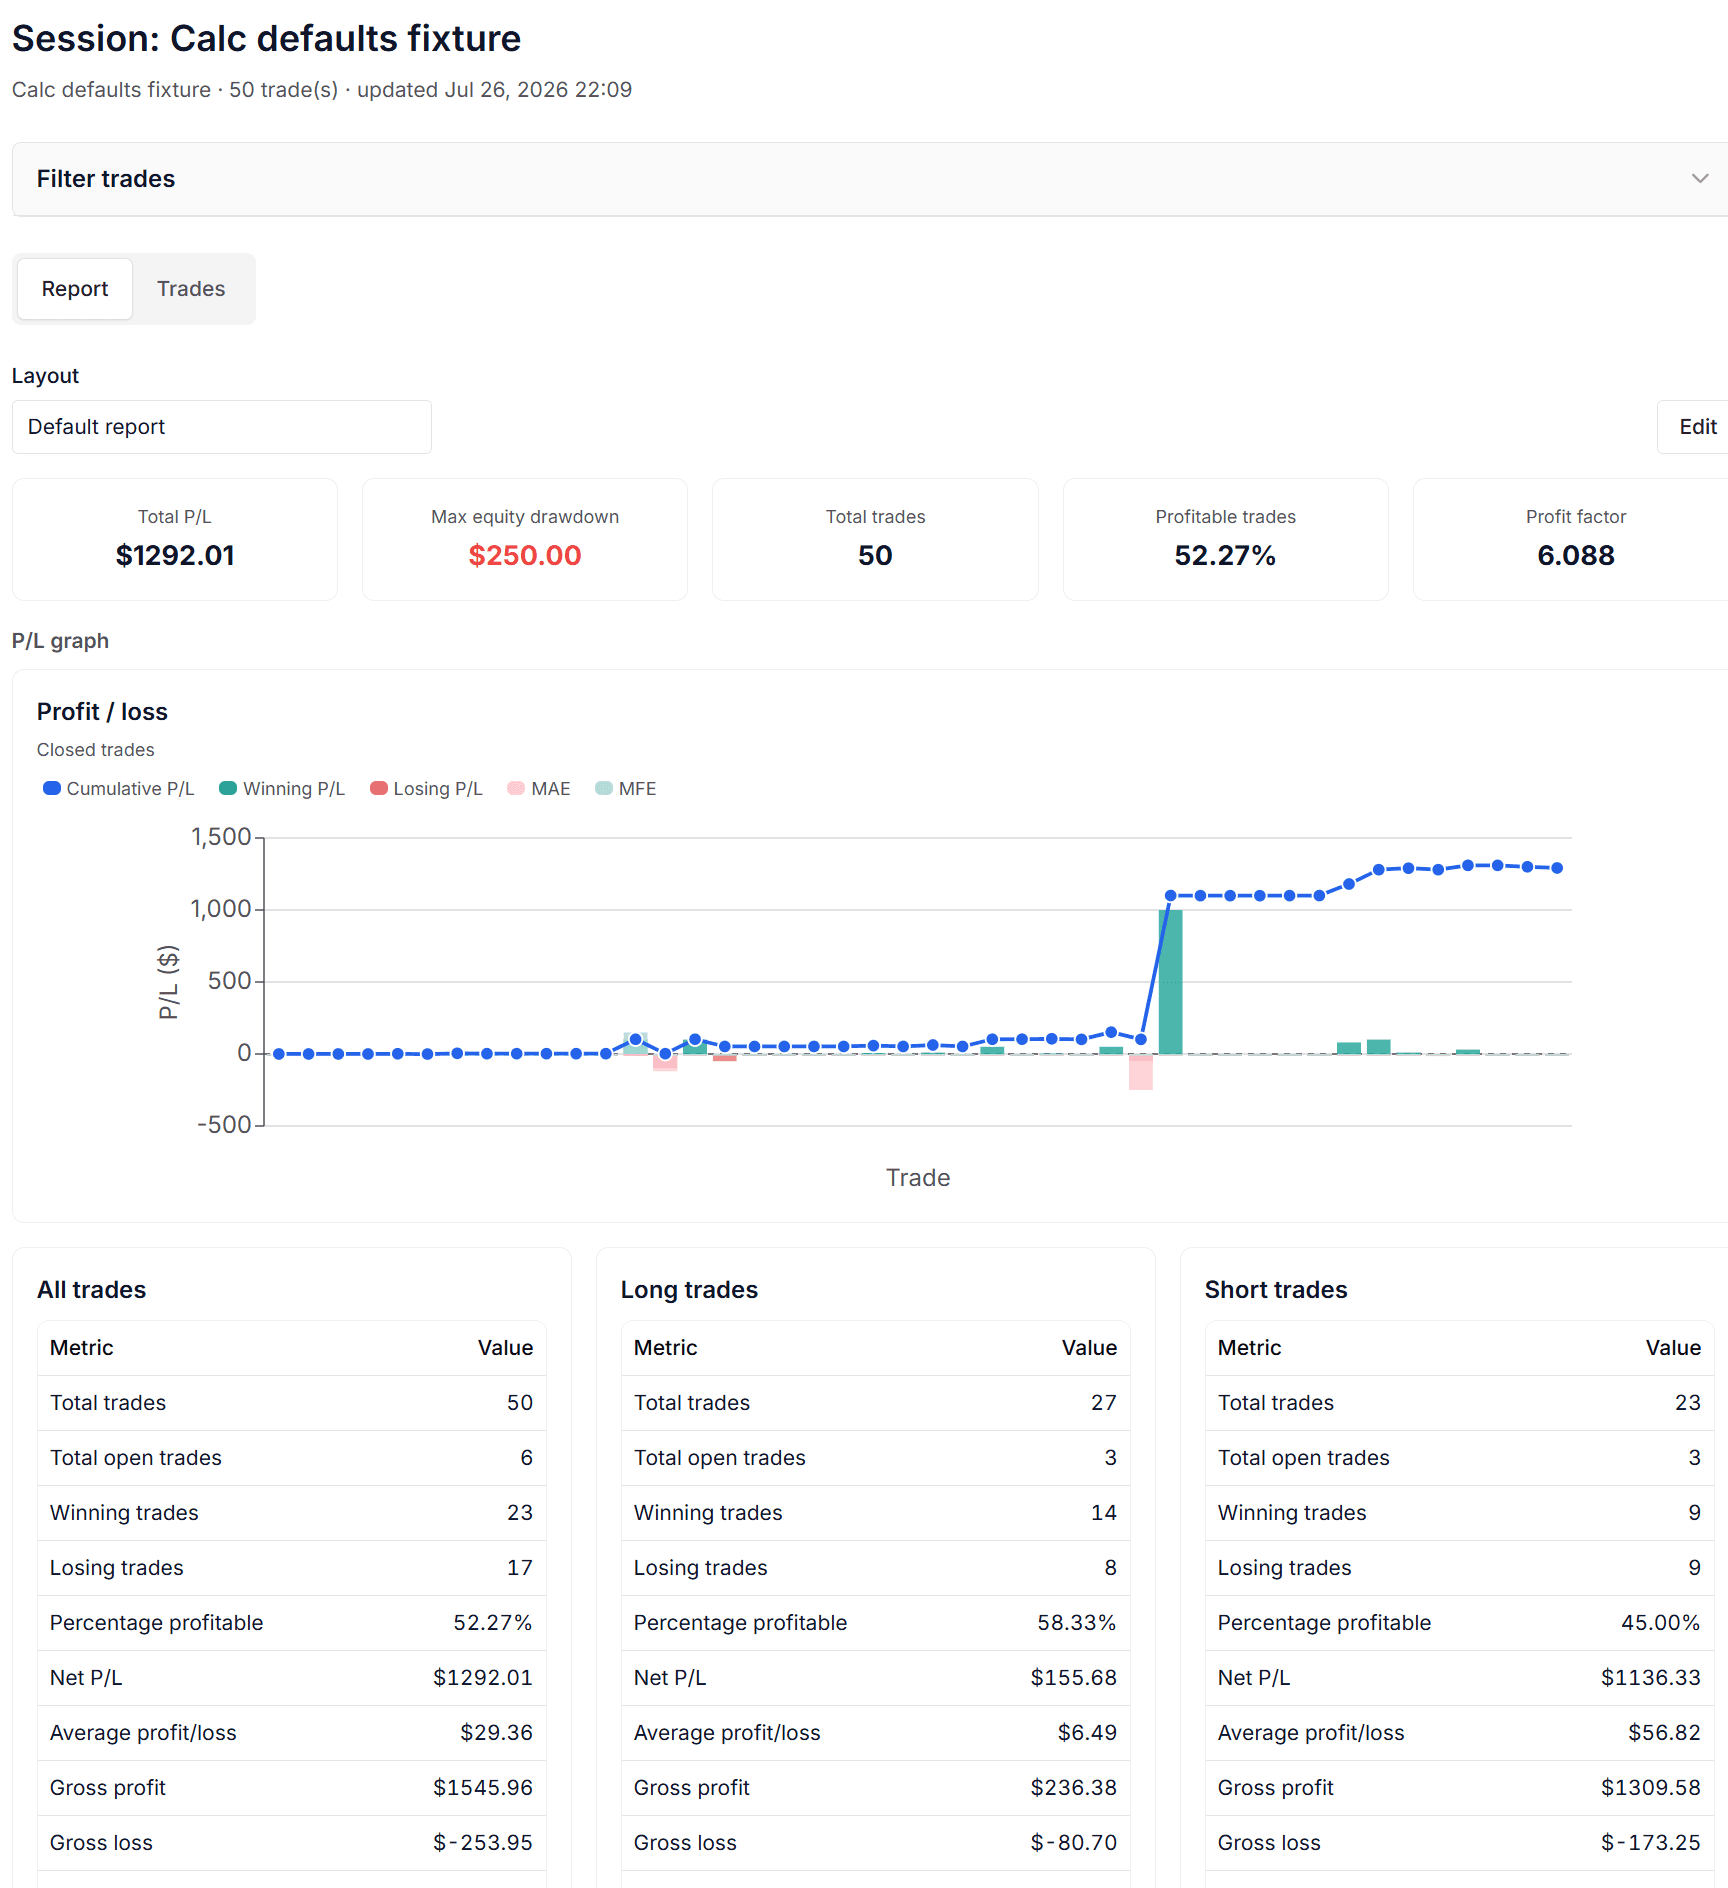
Session Report with performance metrics
Open a session Report tab to review metrics driven by calculations. Start from the public default layout, then customise when you need a different view.
Step 5
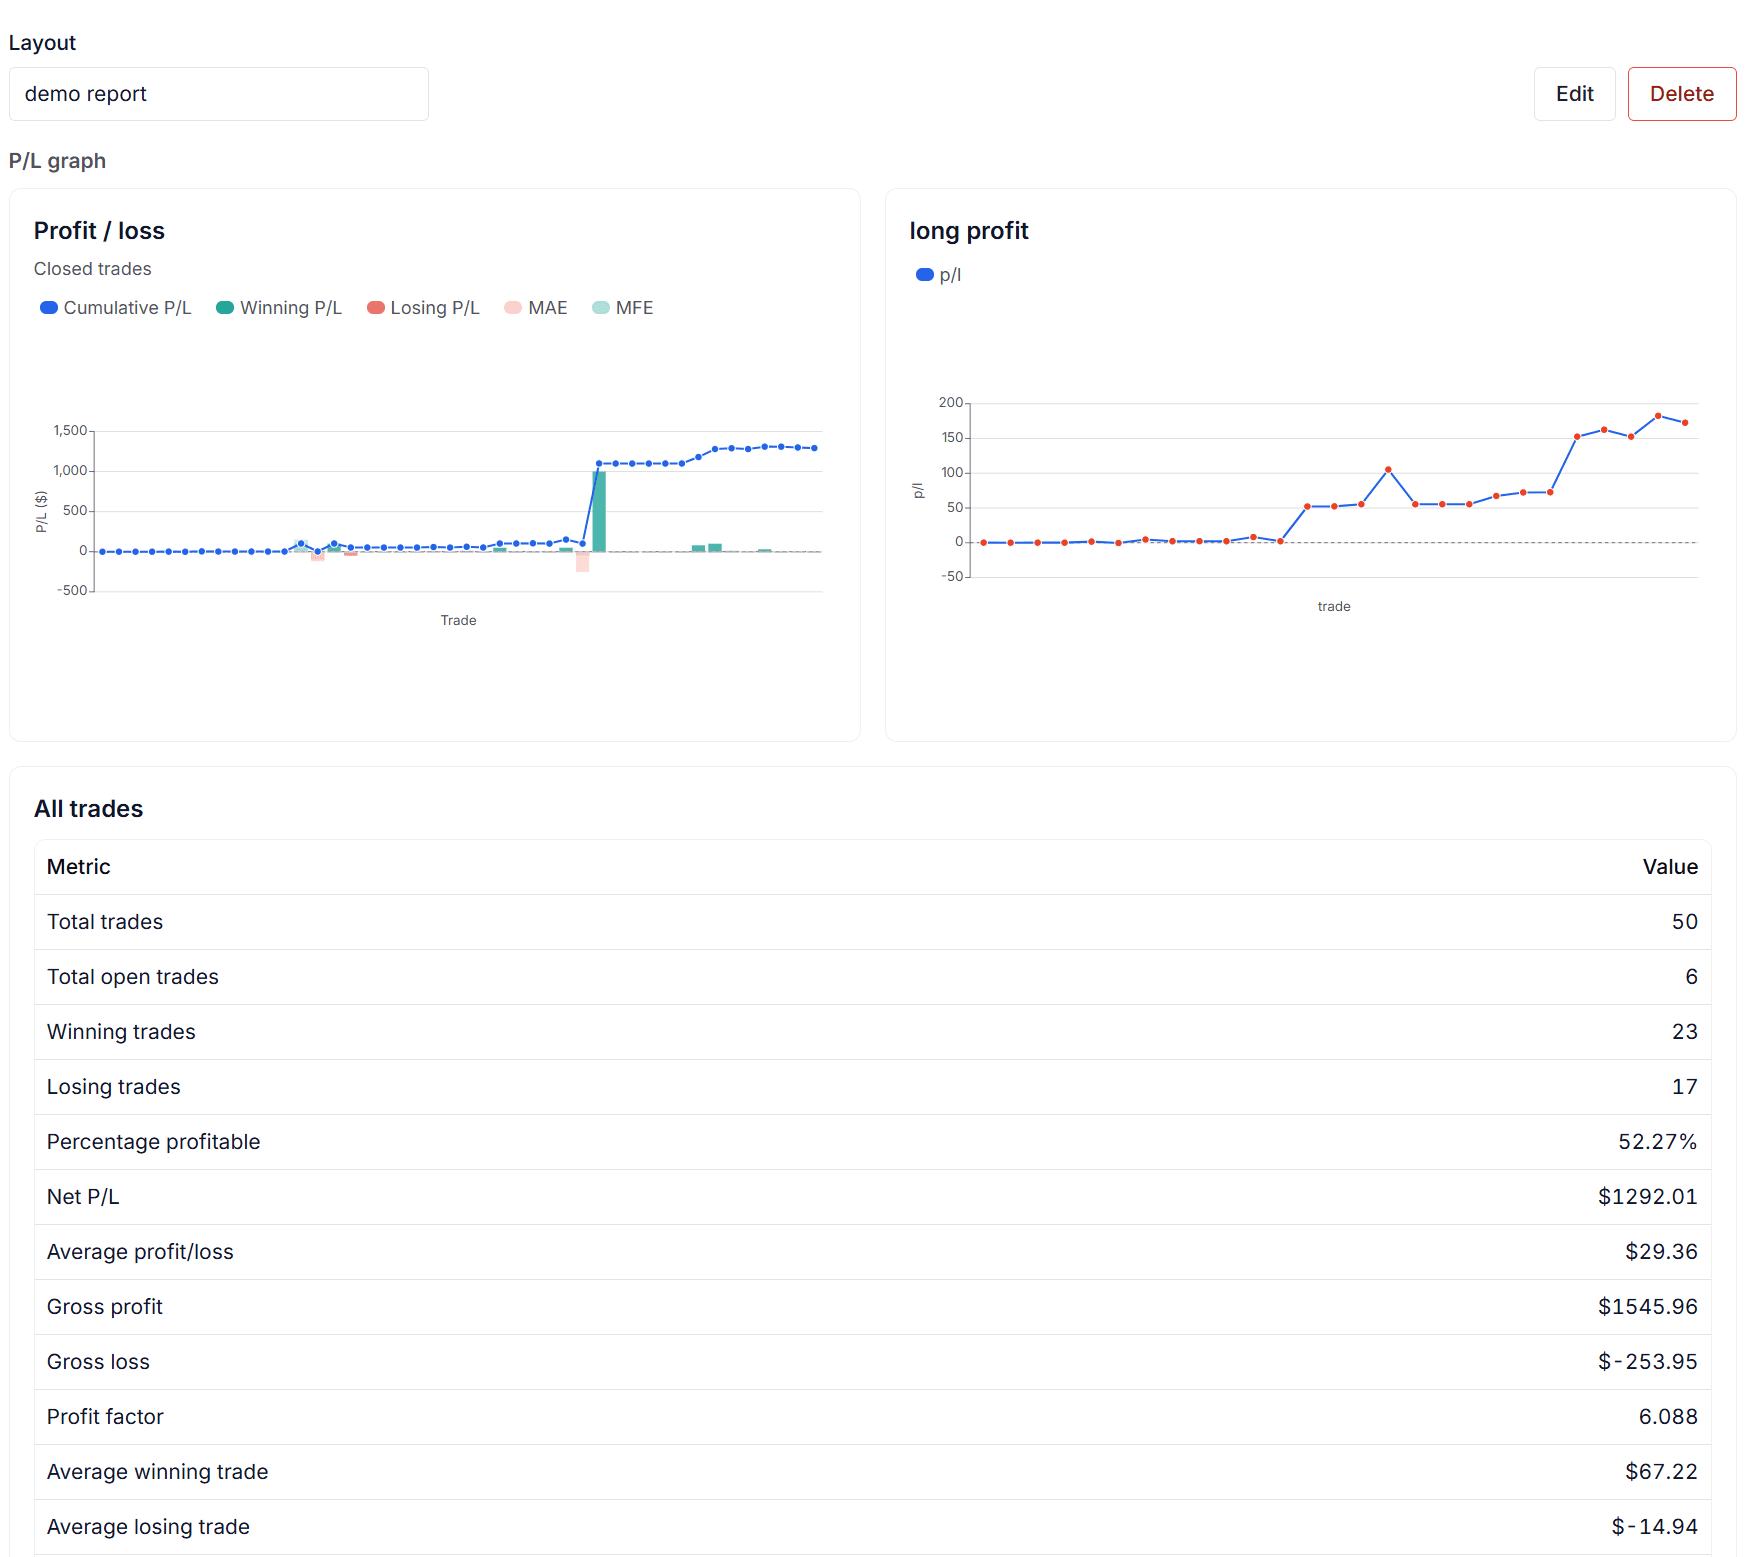
Saved custom report layout
Your owned report layouts appear on the session Report tab — filter trades and bind cards to the calculations you care about.
Next steps
Install from the extension guide, compare plans on pricing, or start with the free trading journal tier.